Asian American Federation
Data Center
This Data Center aims to bridge critical information gaps and provide a first-of-its-kind platform for in-depth analysis on the Asian American community.
Select a region to explore:


Best viewed on screens with higher resolutions
Asian New Yorker Data Highlights
-
New York City Population & People
1,525,851
Asian American Population
-
New York City Civic Engagement
735,778
Total Voting Age Citizens
-
New York City Immigration & Citizenship
65.3%
Foreign Born
FEATURED REPORT
Seeking Help, Finding Hope
In the wake of ongoing racism, violence, and discrimination, Asian New Yorkers are experiencing a mental health crisis. But Asian Americans are often overlooked in the mental health care system, making it difficult to understand the challenges we face in seeking care and how to address them. AAF’s latest report delves into the mental health needs of Asian New Yorkers and concrete solutions to overcoming barriers to care.
Read More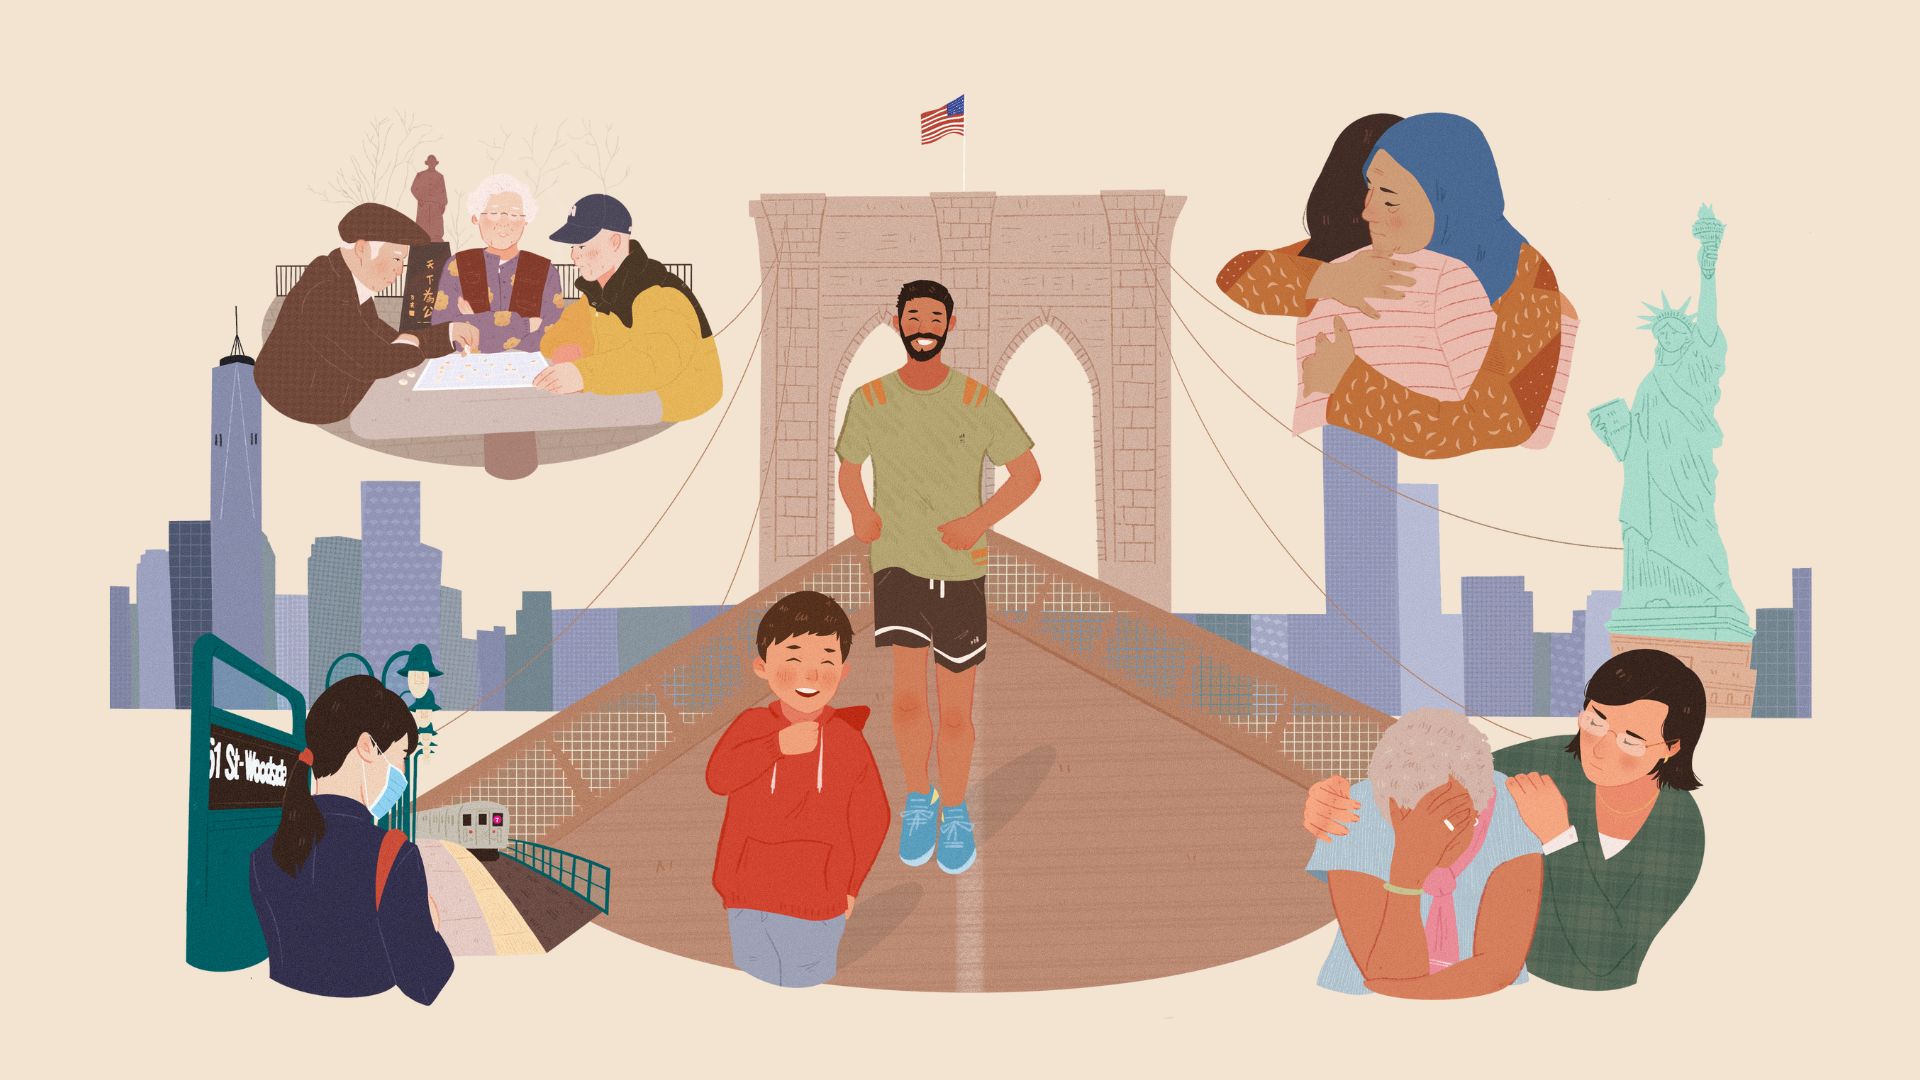
AAF’s Research in the News
1010WINS: More than half of Asian New Yorkers report feeling isolated or anxious, yet many don’t seek mental health services: report
Over 60% of Asian New Yorkers feel isolated or anxious, and more than a third have experienced increased distress due to anti-Asian hate crimes, yet a significant gap in mental health treatment persists as many are not seeking help, according to a new study by the Asian American Federation.

Gotham Gazette: Report Offers Closer Look at Role of Asian American Voters in Brooklyn Assembly Race Flipped by Republican
Chang, who is Chinese-American, defeated Abbate Jr., who is white, 52-48%, a margin of just 582 votes in an election where only 14,287 votes were cast. But according to a new study from the Asian American Federation, an advocacy and research nonprofit, Asian American voters did not turn out significantly in favor of Chang and if they had been more engaged in the election, they could have swung it for Abbate and the Democrats. While there has been some rightward movement of Asian voters, they remain overwhelmingly Democratic in both registration and voting patterns.
NBC News: Asian Americans were overcounted on the last census. Experts say that fact is misleading.
“It definitely came as a surprise to me,” said Linying He, associate director of research at the Asian American Federation. “But this aggregated data is conveying a wrong message. There is a significant difference between the members of our community who are overcounted and those who are undercounted.”
한국일보: 욕시 한인노인 3명중 1명 “경제적 빈곤”
실태조사는 KACF와 샌프란시스코 KACF, 주디스 임 재단과 사우스폴 재단이 공동으로 아시안아메리칸연맹(AAF)에 의뢰한 설문조사를 통해 뉴욕시, 뉴저지, 워싱턴 DC, 시카고, 샌프란시스코, LA, 휴스턴 등 미국내 7개 지역 거주 한인 노인들을 대상으로 진행됐고 거주지, 일상생활, 대중교통, 개인 재정, 건강 및 의료 혜택, 대인관계, 정부 지원 및 비영리단체 프로그램 접근성 등의 항목에 대해 이루어졌다.


AAF’s Data Center is made possible with funding from the Korean American Community Foundation (KACF).